

Hi Everyone,
Thanks for the overwhelming responses in the last weeks. I am truly blessed to write on topics I love and share this passion with this growing community!
In this week’s newsletter, we will do a deep dive into the secondary supply of Uranium. The article will be too long to read in the email view; therefore, I encourage you to read the full version on my substack. I need to preface this as to why this is important. Where are we in our deep dive on Uranium?
Macro environment check!
Supply & demand partial check!
Price dynamic check!
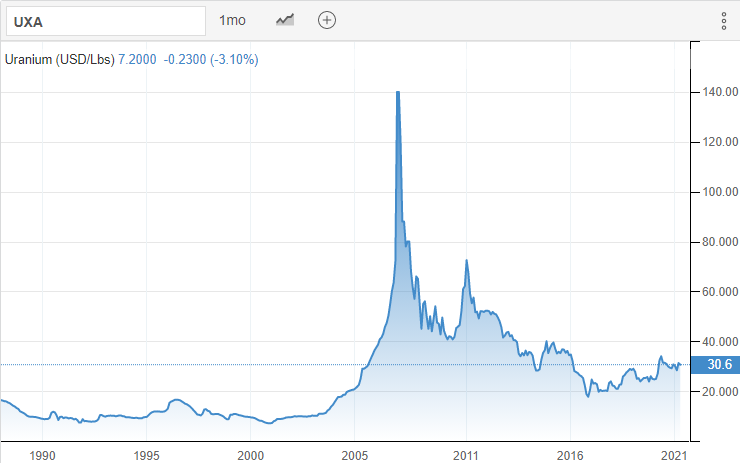
What has been on everyone’s mind, however, is, with the current price of Uranium at 30$/lbs, even if there is a massive regained interest in the sector, we might need to wait another 12 months to 24 months before we see the price rising significantly enough to entice utilities, meaning uranium buyers, to sign long term contracts at 50$/lbs. From the below stock chart from Cameco, in the last 10 years, there have been quite a few times where the uranium sector was primed for a recovery, but it never materialized.
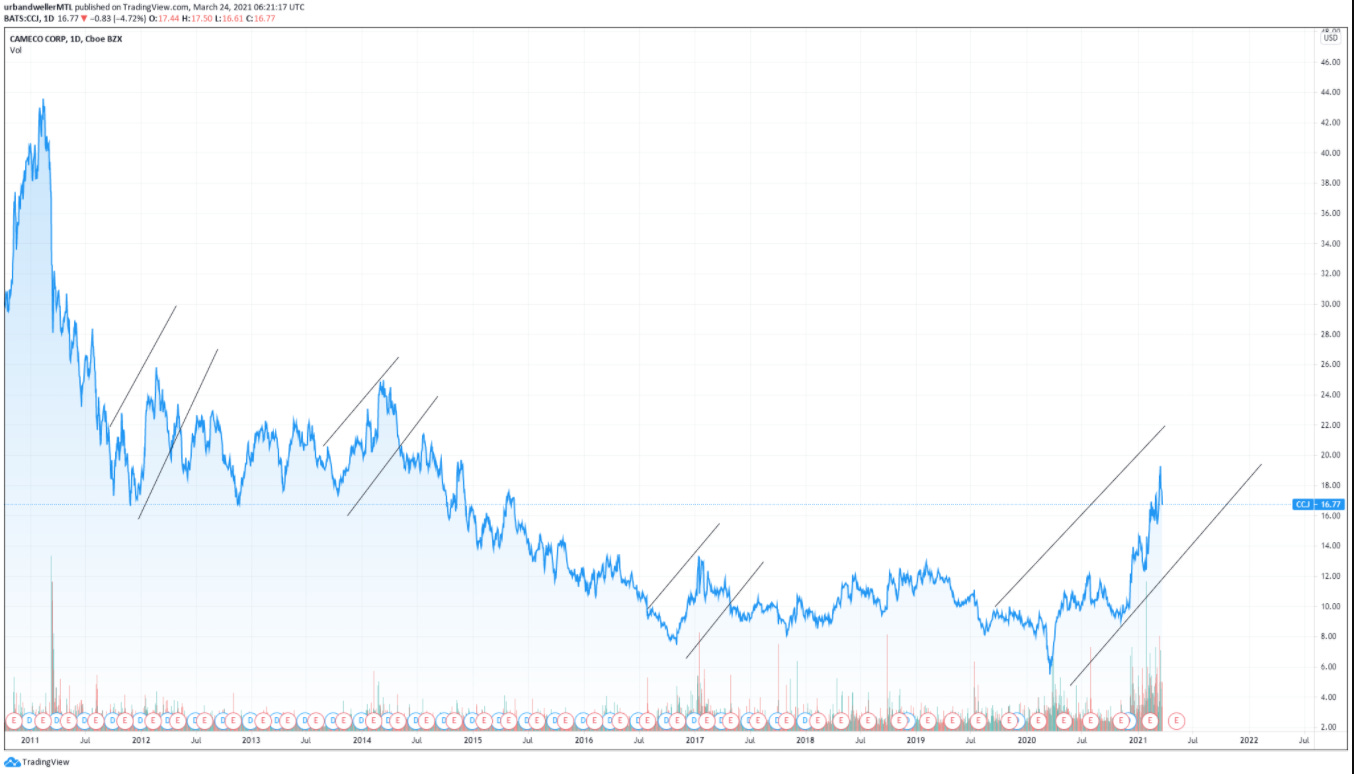
Long-time analysts, utility buyers, and mining executives are therefore wondering whether this is a real bull market or is this temporary. We will see the price of Uranium go back down. Therefore, to have a clearer picture in mind, given a quasi-fixed supply of mines for the next 24 months, the question to answer is how much secondary supply of Uranium can be sold to the market before we need more mine supply. I will be doing a full explanatory part on why 50$/lbs, but let’s say this is the important price to reach in a relatively short timeline to really fuel this bull market in uranium equities. So what is standing in the way of the current price to rise, you ask? Exactly the topic of today’s installment of the Road out of serfdom.
Why should we care about the secondary supply?
My thesis is simple:
Understand the economics behind the secondary supply
Forecast what is the potential change of the supply on the secondary market
Find just how long the current market price can stay at 30$/lbs.
Sources of Secondary Supply
In last’s week’s installment, I used the following graphic from Td securities’ Greg Barnes on Supply and demand forecast. Greg, we thank you for your research! To compare and contrast, we also have Morgan'Stanley’s research which does not materially differ from TD securities’ view.
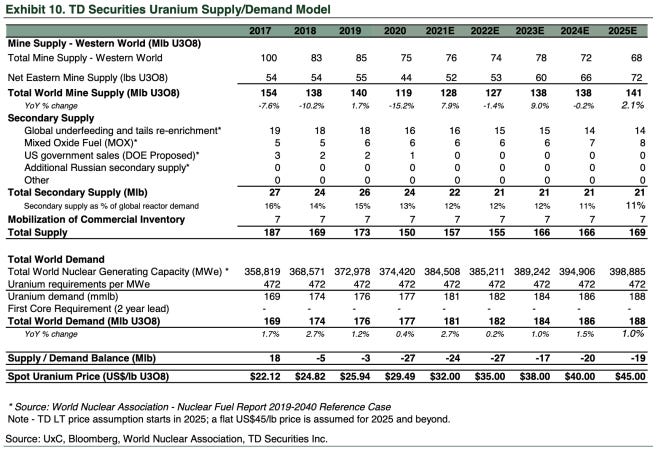
The biggest source of secondary supply is coming from the line: Global underfeeding and tails-re-enrichment. Let us explore how that is produced!
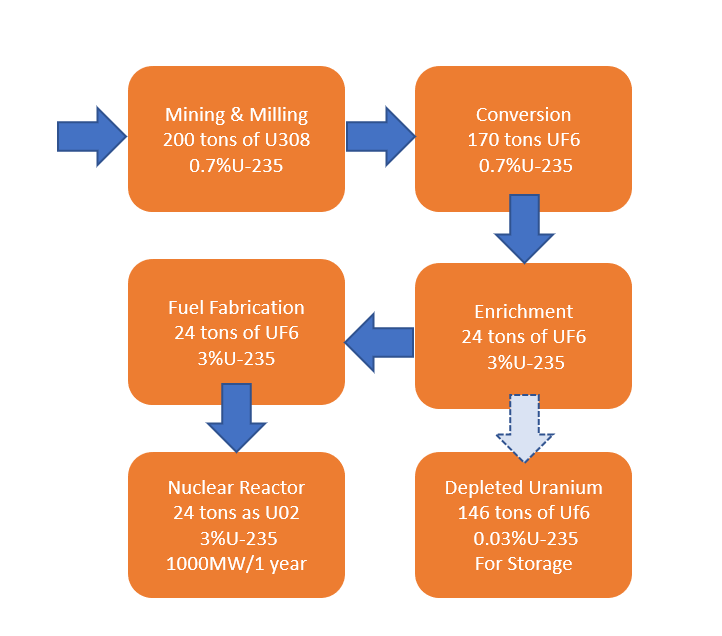
The nuclear fuel cycle is explained.
The below example considers 200 tons of raw material coming from the ground in a typical mine. It then gets converted, enriched from where we fabricate the fuel for nuclear reactors. If you want to get into the rabbit hole of understanding this process, please refer to these articles that were invaluable for understanding this cycle and the tradeoffs.
Chasing your tails assays Part 1
Chasing your tails assays Part 2
The factors that are important to understand are as follows.
There is a tradeoff between the amount of time to enrich the uranium and the quantity of uranium needed.
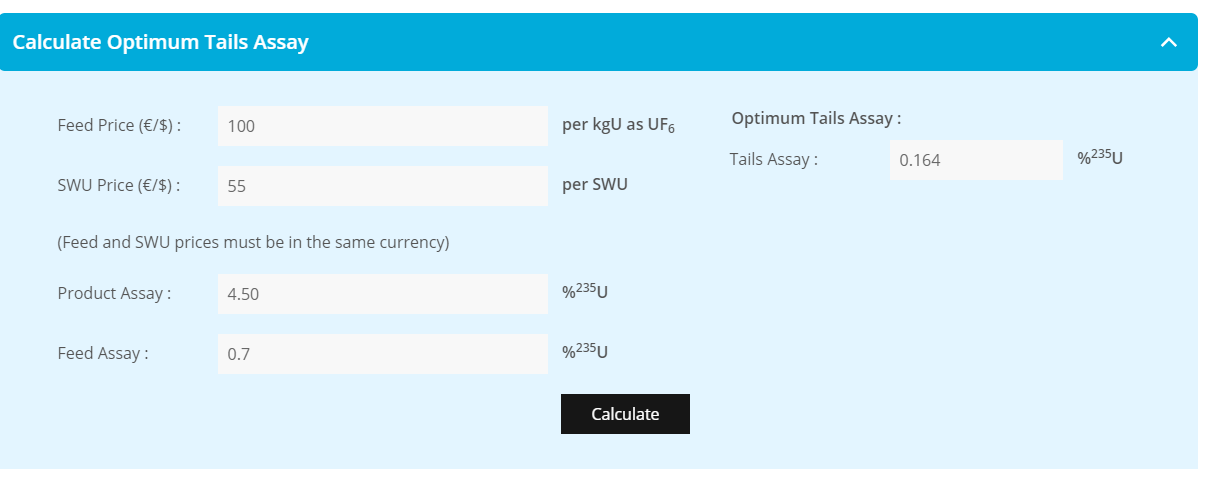
The amount of Separative working Unit (SWU) needed is determined by the cost of this work, the cost of the uranium, and the amount of residual uranium left after enrichment ( optimal tail assay, refer to this calculator if this is of interest to you)
Enrichment facilities can use less uranium and enrich it for longer or use more uranium and enrich it for a shorter period of time to get the final product.

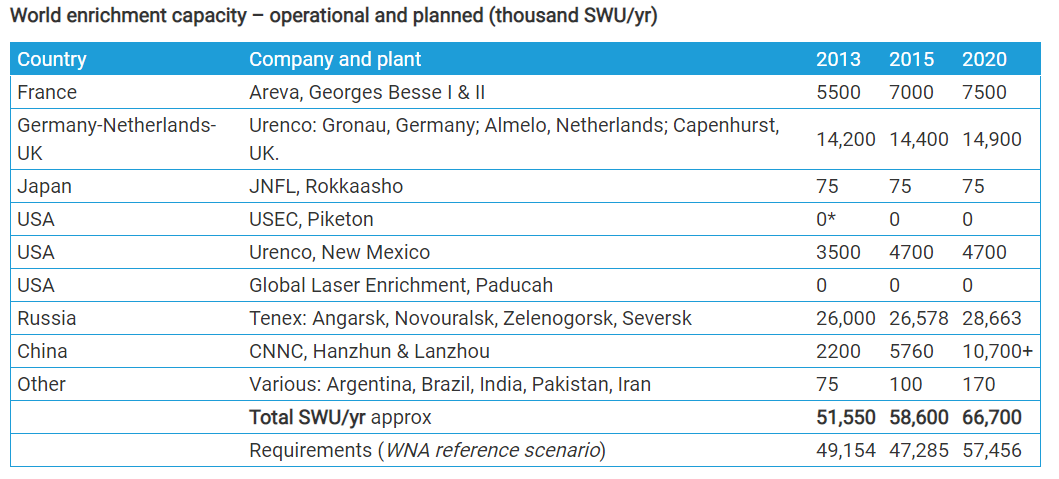
Just like uranium miners, enrichment facilities have their own unit economics to live with to make a profit. Since it is costly to stop this enrichment process, the current enrichment facilities usually continue to enrich uranium regardless of the market's uranium price. Now that we have understood that the price of the uranium ore that is mined and the enrichment prices are two different things, the other conclusion that we can infer is that uranium and enrichment are substitute goods. This dynamic has exacerbated the price decrease of uranium from 2011 to today. From the world nuclear Association website, we know that the amount of enrichment capacity since 2013 has increased significantly.
That, coupled with the oversupply of mines and the Fukushima incident, created the perfect storm to drive the spot uranium price to its lowest since 2011 in 2016 at around 10$/lbs as depicted below.
Recent development in the spot market
In the last 2 months, several companies decided to intervene in the market to procure themselves with uranium. Here is the exhaustive list below:
April 6th: Peninsula Energy 0.4M lbs for 2022 delivery
April 6th: Encore Energy 0.2M lbs for April 2021 delivery
April 6th: UEC 2.1M lbs unto December 202 delivery
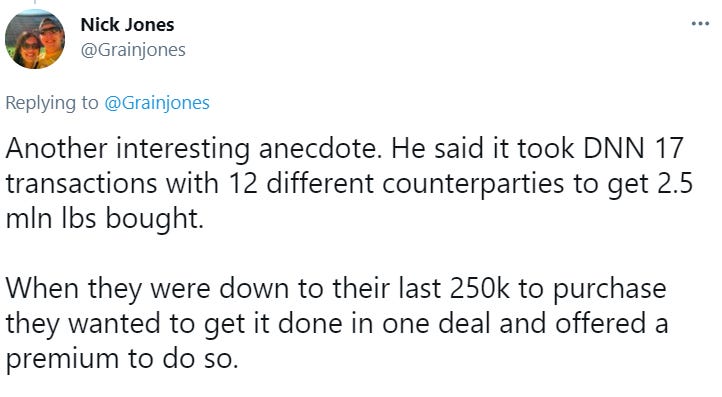
April 1st: Denison Mines 2.5m lbs for 2021 delivery
March 29th: Boss Energy 1.25M lbs for April and June 2021 delivery
Late February: Yellow Cake increase its original purchase from 9.3M lbs to 13.2M lbs to KAP
These numbers do not account for Cameco’s mine closure, forcing them to buy roughly 10million lbs on the spot market to make delivery on their contractual obligations. The same is also true for Kazatomprom, although I do not have the number of LBS they will need to procure themselves. Since their mine closure has been following the same path as Cameco, it would be wise to assume roughly the same amount. Let’s do some quick math. There would be between 22 million lbs in 2021 and 21 million lbs of secondary supply available for purchase from the above secondary supply. We have from our above purchase we get to a possible need between 20 to 30 million lbs. Furthermore, sources close to the topic said Denison Mines had to do 17 transactions with 12 different parties to get this supply. The final cherry on the sundae, although I assumed this was neutral news at first, Cameco’s news release that they will restart cigar lake in April, which was shut down because of the covid 19, couple with Denison hazardous road to find the supply in quantity suggests to me that even if Cameco/KAP wanted to keep buying on the spot market for a prolonged period of time, this would have been quite complicated to locate any significant amount of uranium such as they need it. What could change this equation? From the above SWU calculation and deep dive, we know that if there is less uranium mass to produce uranium fuel, we could increase the output by enriching for longer. This is bound by the enrichment process total capacity of production, but if I got this process correct, we could see an increase of SWU to help the supply situation. This will also make sense when looking at the price of SWU and the conversion price, which might hint at where the market equilibrium is at.
Do we really need to wait for another 24 months?
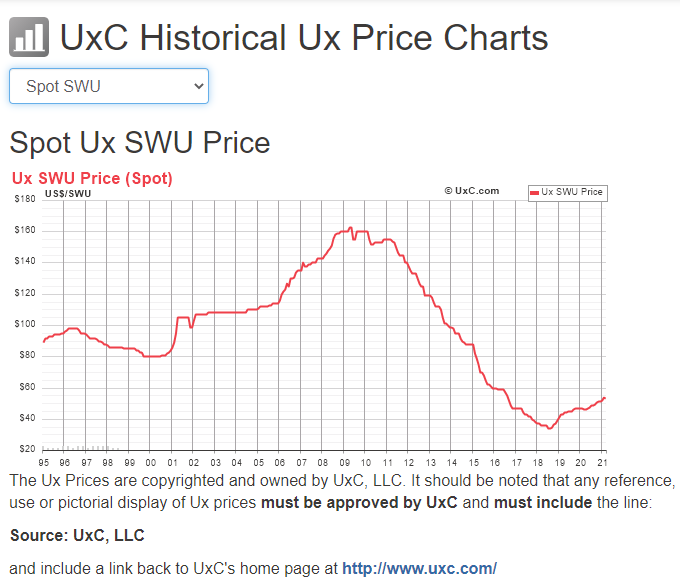
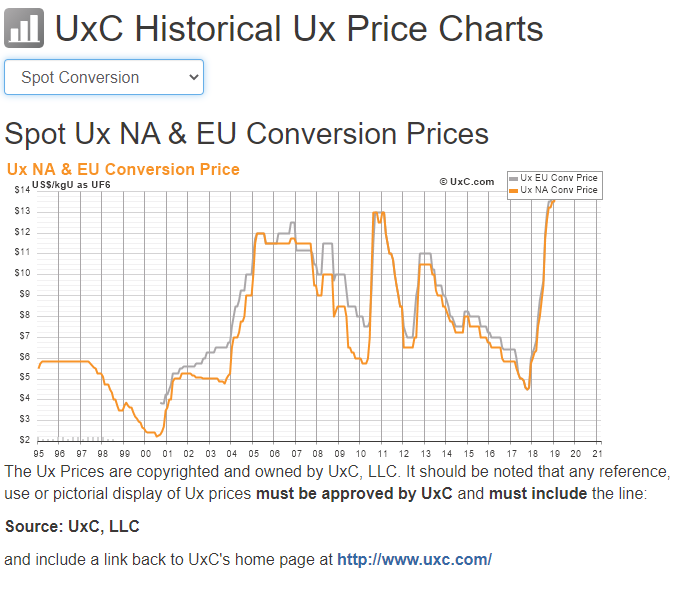
I am certainly prepared to wait this long for the spot market price and long-term price to move to 50$lbs however;, I cannot believe we will have to wait this long anymore. Covid 19 accelerated our thesis, and I am beginning to wonder if it is not reasonable to think utilities will come back to the table to sign long-term contracts before the end of the year. Other encouraging signs pointing in the direction that this is happening are looking at the price of conversion and the price of SWU. Both underpin a tighter market than the spot price would otherwise indicate.
Special thanks to many folks in the uranium community: Uranium insider, John Quakes, Yellowbull, Nick Jones, @808sandU3O8, Silverchartist, trader_ferg, UXC, for providing exceptional content to help us in forming our thesis.
Final note: I already had my first interview with Baselode’s James Sykes last week and found it invaluable. I will be interviewing someone from Energy Fuels, Marc Chalmers, I think, during the last week of April. Should this be of interest to you, shout out as I might have a few places left on the call to either listen in or ask questions.
I welcome all your comments and feedback,
Max
Thanks for sharihg this excellent analysis. Another potential source of secondary supply are cicil stockpiles. Do you have any figures on the current stockpile/consumption ratio and the historic average?