

Is oil going to 150$?
Is oil going to 150$?
Jeffreys and JP Morgan say yes

Hi Everyone,
I hope you enjoyed your January. A gentle reminder that there are ten months left to achieve all those goals you set forward to do only a few weeks ago between your Christmas and New Year gathering.
Today we will discuss the opportunity (is there still upside) in the oil sector. We will focus as we usually do on the following points:
1- Supply
2- Demand
3- Price
We want to point out that we feel very indebted to Kuppy, John Polomny, Doomberg, Bison Interest, Josh Young, White Tundra investment, Adam Rozencwajg, Eric Nuttal, and everyone else on Twitter for bringing out attention to the oil/gas equities in that sector.
In our first piece in January 2022, we discussed how we were bullish on oil and oil and gas services companies. We also mentioned that we would like to see a sector pullback before entering into a sizeable position in the sector. A meaningful retreat has not happened yet, which means we are still underweighting our desired position in that sector. We would caution anyone wanting to enter this sector; we are conscious that we are late to this party and that the easy money has already been made. Now, onto the actual thesis.
Demand
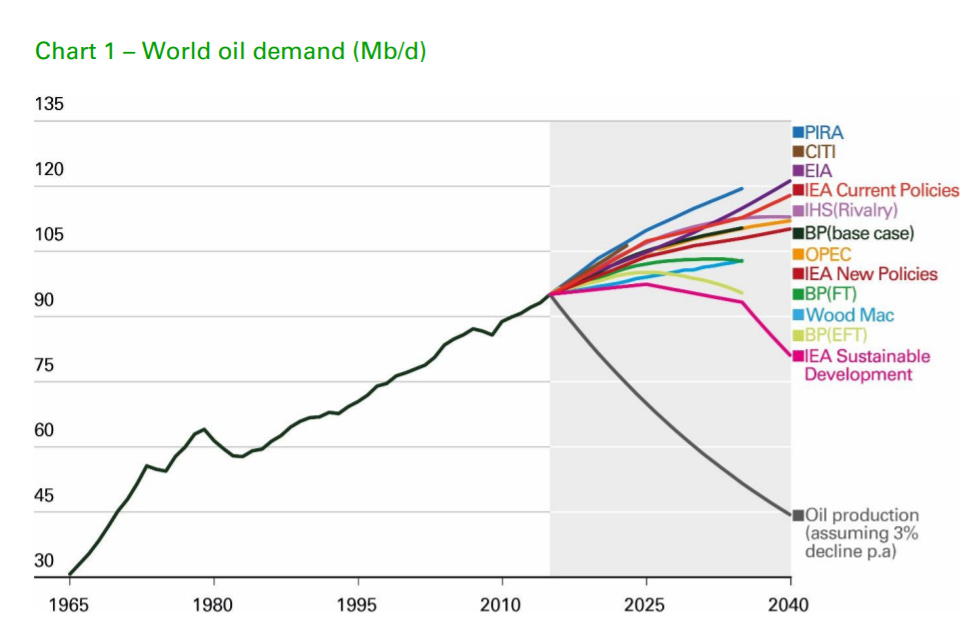
The first chart below outlines the different demand cases in the next 20 years, whereas the second chart shows the supply and demand functions in the near term. The first interesting point to watch out for is the continued growing demand for oil and gas until the late 2030s. 1 The second interesting point is bar a recession or a demand shock coupled with an increase in supply; it sure looks like we will keep drawing on oil inventories instead of building them back up.
While we neither embrace the increase in demand for oil nor condone it, suffice to say that the growing worldwide population, especially in Asia and Africa will contribute to this long-term outlook. 2

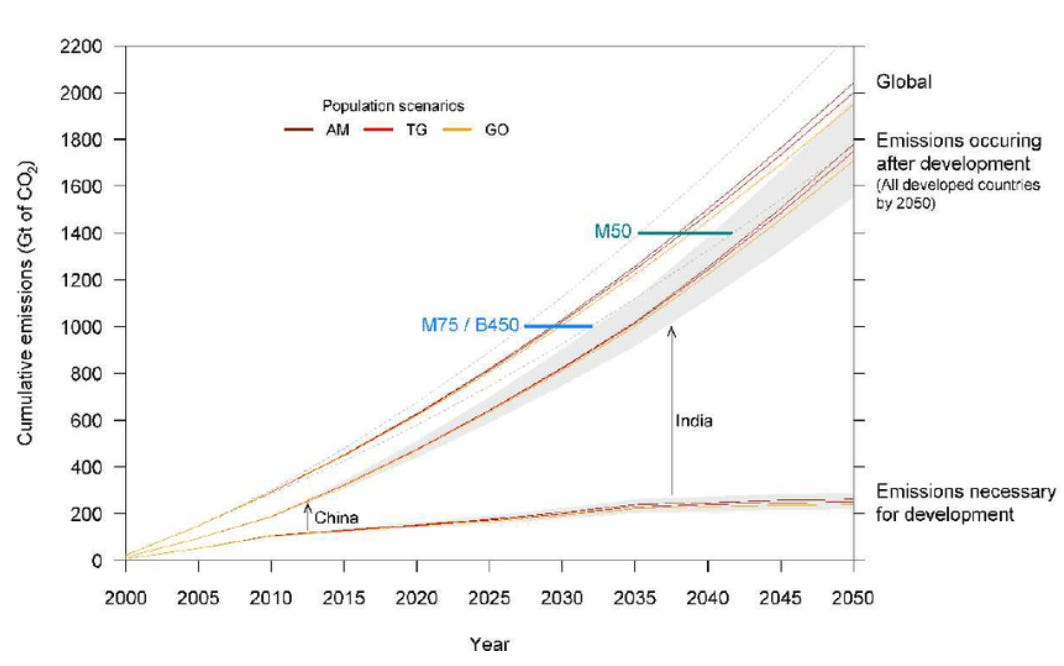
The most important figure to retain from the current world demand for oil/gas is that more than 60% of the world population, mainly from Asia, Africa, and Latin America, uses less than 75 Gigajoule of energy per year. Alright, what does that mean? A 100 watts lightbulb needs about 3 gigajoules to run for an entire year. (yikes, that's not much) There is further evidence of the correlation between the human development index and the increased demand for energy as seen from the graph below. Said another way, if we want Africa, Asia, and South America to reach the same level of economic development as we have enjoyed in the western world, the increase in energy demand from fossil fuel is not going to diminish anytime soon.3
Price
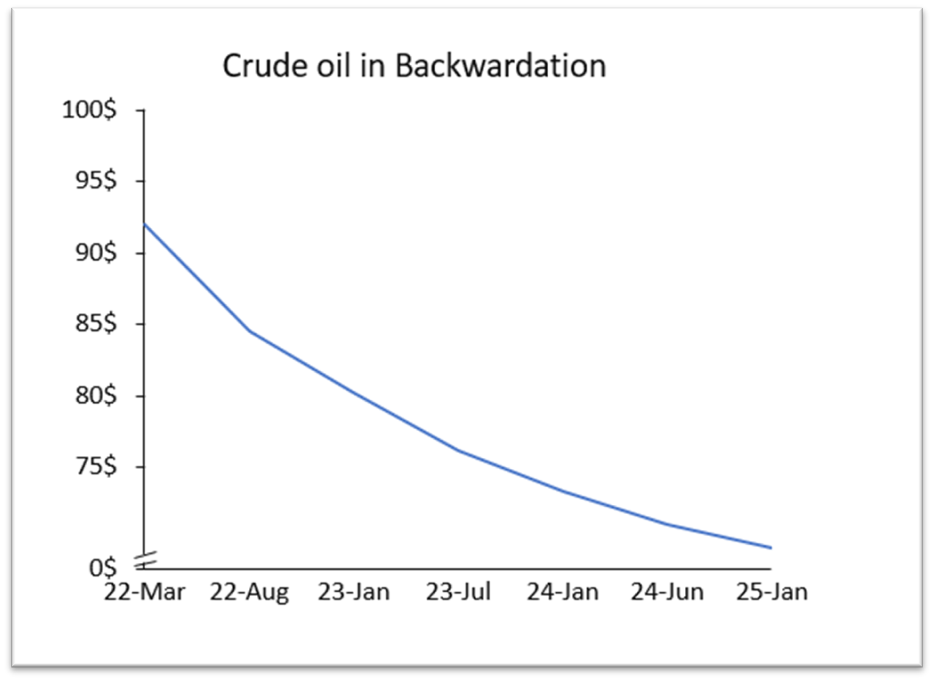
You could say, but why focus on price? Isn’t it just the end effect of the demand and supply balancing each other? Indeed, you still remember your economics lesson 101; however, the focus on price here is vital because it informs market participants’ capital spending decisions in the future. Let us introduce two concepts here: Backwardation and Contango. Backwardation happens when the price of an asset, in this case, oil, is currently higher than it is in the future price, whereas contango is the reverse and would be what you would typically expect. Why you might ask? Simply put, the future is uncertain. We prefer having a dollar now than a dollar next year, and if we are to wait for a year, we will choose to be compensated for this uncertainty. I drew a plot of the futures price on the West Texas Intermediate for the March contract, July contract, and then every six months after that until January 2025.
Why is this graph important? Let us introduce another concept in business/finance, which is the capital spending plan. The capital spending plan is the management’s way to spend the free cash flow4 generated from the company. The numbers that I will state will be wrong but give you a good idea of why the price is essential. Imagine an oil-producing company with 100m in free cash flow. Management’s guidance on any new project is the following: Any project with an internal rate of return of less than 25% will not be moving forward and instead will be used to pay down debt or increase dividends. They might consider brownfield drilling from 25% to 50% IRR, meaning drilling next to their current oil wells. They would need 100% IRR for greenfield drilling, meaning drilling in unknown areas. Again, the numbers are wrong but reflect that the more uncertainty is linked to a project, the higher the internal rate of return will need to be for management to move forward with the projects.
Alright, you have bored us to death with corporate finance and capital spending plans. What is the link back to price? I drew another example of how the price will drive future capital spending decisions. In the example, we start with a project requiring 12m in Capital expenditure. As you can see, with the current oil price, management would not pursue this project because the future price of oil does not make the project break the barrier of 25% IRR. I also showed conditions under which the project could go forward. You might say these numbers are wrong, this is one firm example, and you would be right. However, the concept highlighted below can be extrapolated to the total market. It can therefore give you a hint as to how firms are likely or unlikely to increase their CAPEX in the future to increase production given their cost curve and the future price of oil which is below 75$ a barrel in Mid 2023. We would venture to say that this price is not high enough to incentivize an increase in future production.
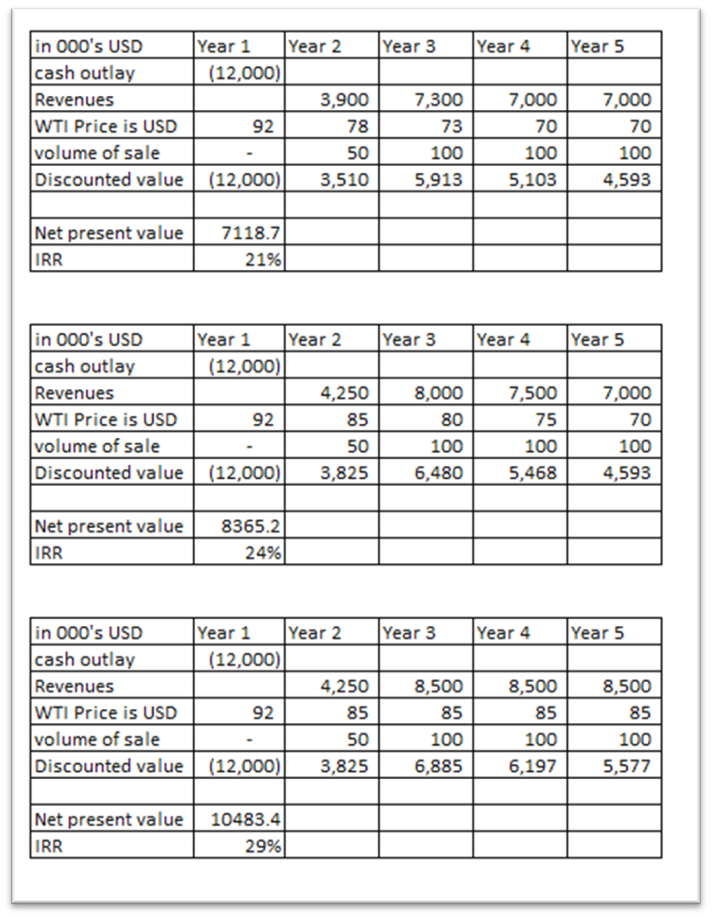
These scenarios are overly simplistic, you might say, and you would be correct. So instead, I intend to illustrate, ceteris paribus, how the future oil price will be a defining factor in the prospective firm’s decision to increase CAPEX to increase production.
Interesting note from RBC on the oil price forecast below seeing elevated price until at least the end of 2023 and a whopping increase from their prior forecast of 76$. The comments are pretty bullish!!

Jerome Powel
If you missed Harris Kupperman on the market huddle podcast this weekend, you really should give it a listen because he explains the following very well.
In my example, our fictitious firm faces very low-interest rates to fund its debt. What happens when the federal reserve decides to increase interest rates after March? Analysts are now pricing in 5-7 interest hikes meaning the prime rate would increase to 1% -2%; companies now need to roll over their debt but need to do so at a higher cost? Looking at the formula for free cash flow, Nopat -CAPEX, we see that an increase in interest rates will decrease Net Operating Profit After Tax and decrease overall free cash flow. Simply put, some firms might not even entertain increasing CAPEX and instead will need to pay back debt.
As I laid out above, each firm faces a production and capital spending plan. Their figures will be different, but you can rest assured that until and unless we see a firming up of the price at the long end of the curve for oil ( refer to the futures price curve I drew above), we are likely to keep seeing firms distribute free cash flow in the form of dividends and share buyback programs, i.e., not seeing an increase in production.
I highly recommend a further resource to get more background and understanding of why oil output will not increase with the flick of a switch. The end of the episode is about anecdotal evidence in the oil service sector. Simply not being able to supply more rigs to increase the oil production is shocking to anyone not in that line of business.
Supply
You might ask, who cares if the demand is increasing for oil? Saudi Arabia, Venezuela, the shale patch in the USA can all increase production if they want. I also read that Iran was going to reach a nuclear deal, increasing output by 1.3m barrels per day. Nothing to worry about! let’s deconstruct this line of reasoning and see if it holds!
400,000/Barrels per day increase
This is the number you should keep in mind. OPEC has announced in late 2021 that it would increase its production by 400k barrels per day. Makes sense! They have the reserves; the prices increase, so why not capture this incremental profit? Since that announcement, the problem we have witnessed is that OPEC has felt short of this target every month. If we were to go back in time, we should point out how difficult it was for OPEC to keep its members from sticking to their target and not overproducing, which should raise red flags to anyone why they would not be able to now get to their desired results.
“OPEC+ has aimed to raise output by 400,000 bpd a month, with about 254,000 BPD of that due from 10 participating OPEC members, but production has increased by less than this as some producers struggle to pump more. read more
The report showed OPEC output in January rose by just 64,000 BPD to 27.98 million BPD.
Seven of the 13 OPEC members had a drop in output, among them Venezuela, Libya and Iraq.
Top exporter Saudi Arabia boosted output by 54,000 BPD according to the report, but Saudi Arabia told OPEC it made a larger increase of 123,000 BPD that brought its production to 10.145 million BPD." ““ ”5
Iran
"The price could already be in triple-figure territory if not for the nuclear talks between the U.S. and Iran," said Craig Erlam, market analyst at OANDA, noting a deal "could mean around 1.3 million barrels per day (BPD) of crude quickly re-entering the market." "6
On the surface, it looks like 1.3m barrels per day would re-enter the world supply. Still, many experts have been quick to point out that Iran has kept exporting oil during the embargo, and the 1.3m would be the very high bracket of output. In contrast, more reasonable estimates of 300k to 500k would be the expected average outcome. Whatever that number is, it is safe to assume we will see increased supply from Iran in the coming months, and the markets are already discounting this as we have seen oil come off its high print of 95$ a barrel on Monday after Russia/Ukraine tension were at their highest.
American Shale
In the last oil boom, we had seen a resurgence of oil export from America fuelled by the shale revolution. We would be quick to point to our readers that this revolution created oversupply from cheap debt subsidies, ever-growing CAPEX to increase production, and a complete disregard for economic reality. Most of the shale oil was uneconomic below 60$ WTI.
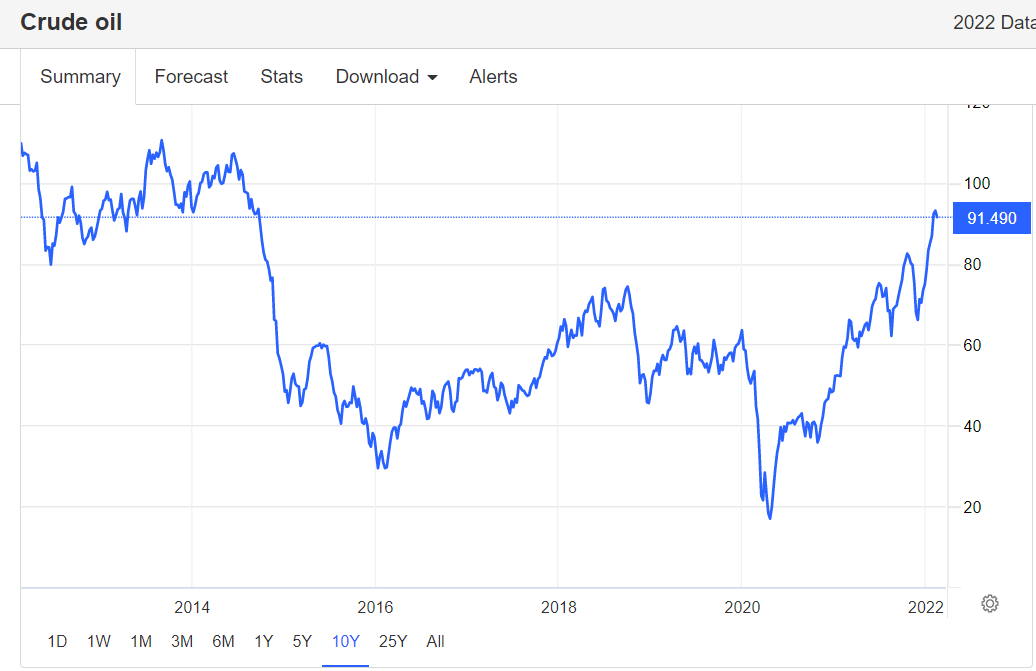
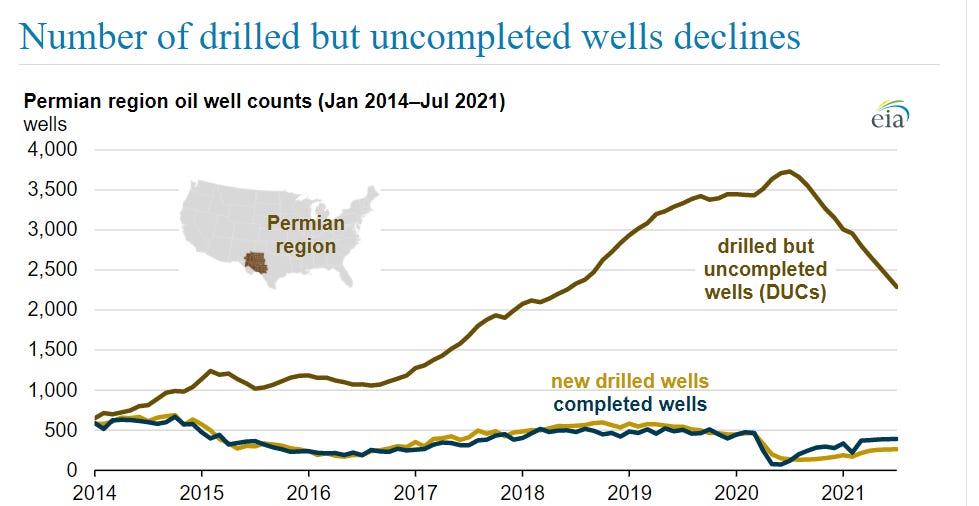
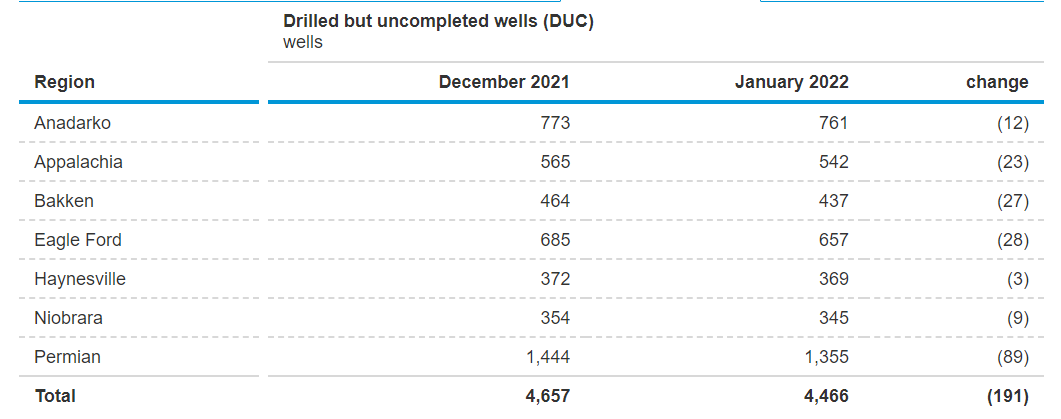
The ensuing pain was the 2014 onward bust, decline in commodity prices, bankruptcy, and consolidation. Management teams have been burnt, careers were ended, oil workers laid off and have moved on to other careers. The few investors that stayed in the space told management teams that capital discipline, repayment of the debt, and increasing return to shareholders was the direction they needed to hav. The equation would be simple to understand. If we want more supply, we need more money to drill for more oil. Is this happening? The chart below is a proxy of “inventory” in the USA. Drilled but UnCompleted wells are wells that have been drilled but have not yet been in production. An important factor to note, after 2 years, those wells become increasingly difficult to tap into. An operator still needs servicing to be done to get the well to start pumping oil, and if you refer to the interview with Kuppy above, most crews are contracted for 2022 and 2023, which means there is a cap to how much of these wells can turn back into production. The below graph tells us that management teams are using their inventories but are not replenishing them, seen by the decline in total DUC. The second below chart is the latest updated version, but the visual on the first graph illustrates the situation even better.7
Wrapping things up
Potential increase in Iranian output offset by a longer-term decrease in American shale and incapacity of OPEC to increase their production by their desired +400k barrels per day. The next few months will tell us where we land precisely on the Supply and demand balance.
Portfolio update:
Unfortunately, I will not publish detail of the portfolio in this column anymore. I will still update you on the significant movements, but I got way too many private comments around “how can you be pumping your investment so much,” while obviously, this has never been my intention. I wanted to provide transparency, but it seems this was misconstrued as something else.
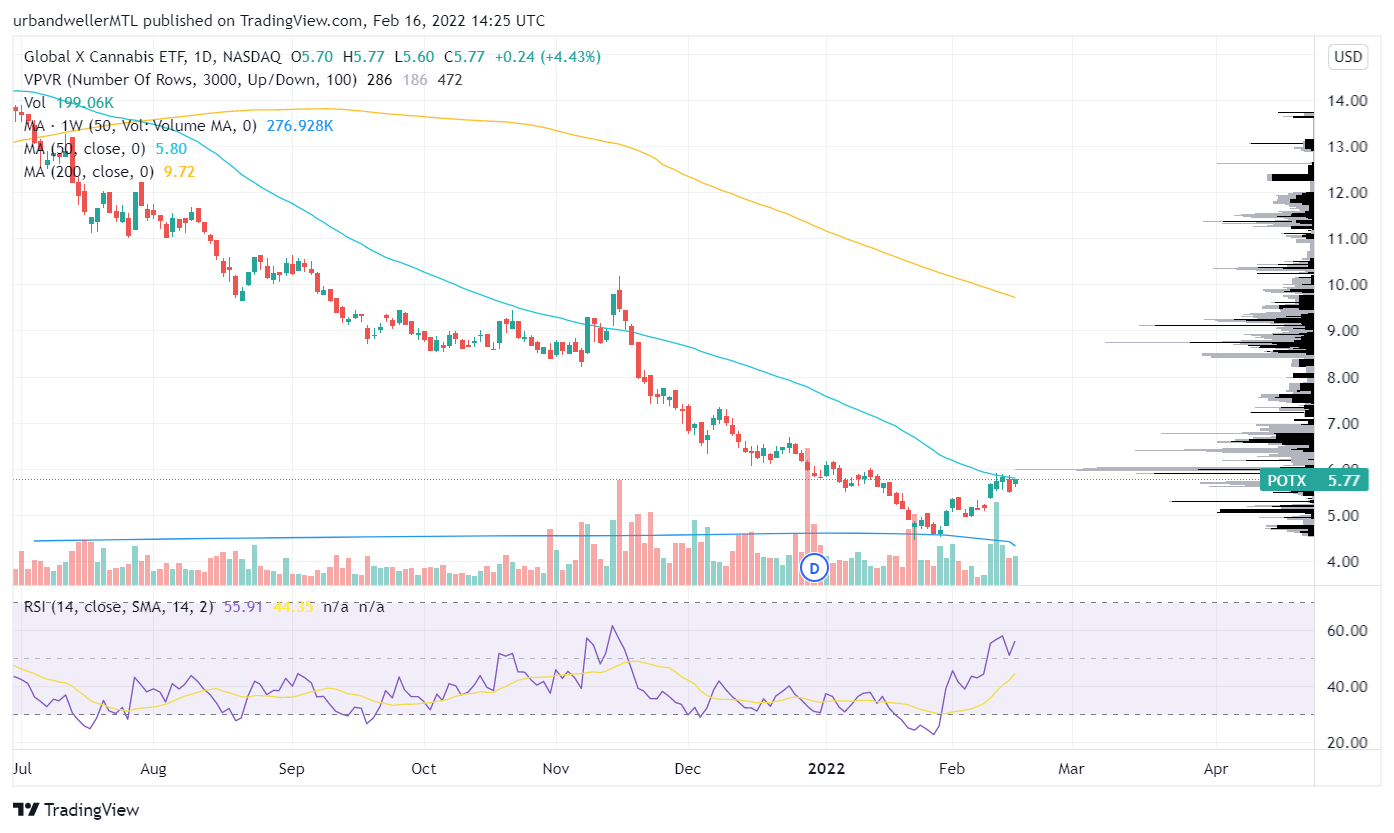
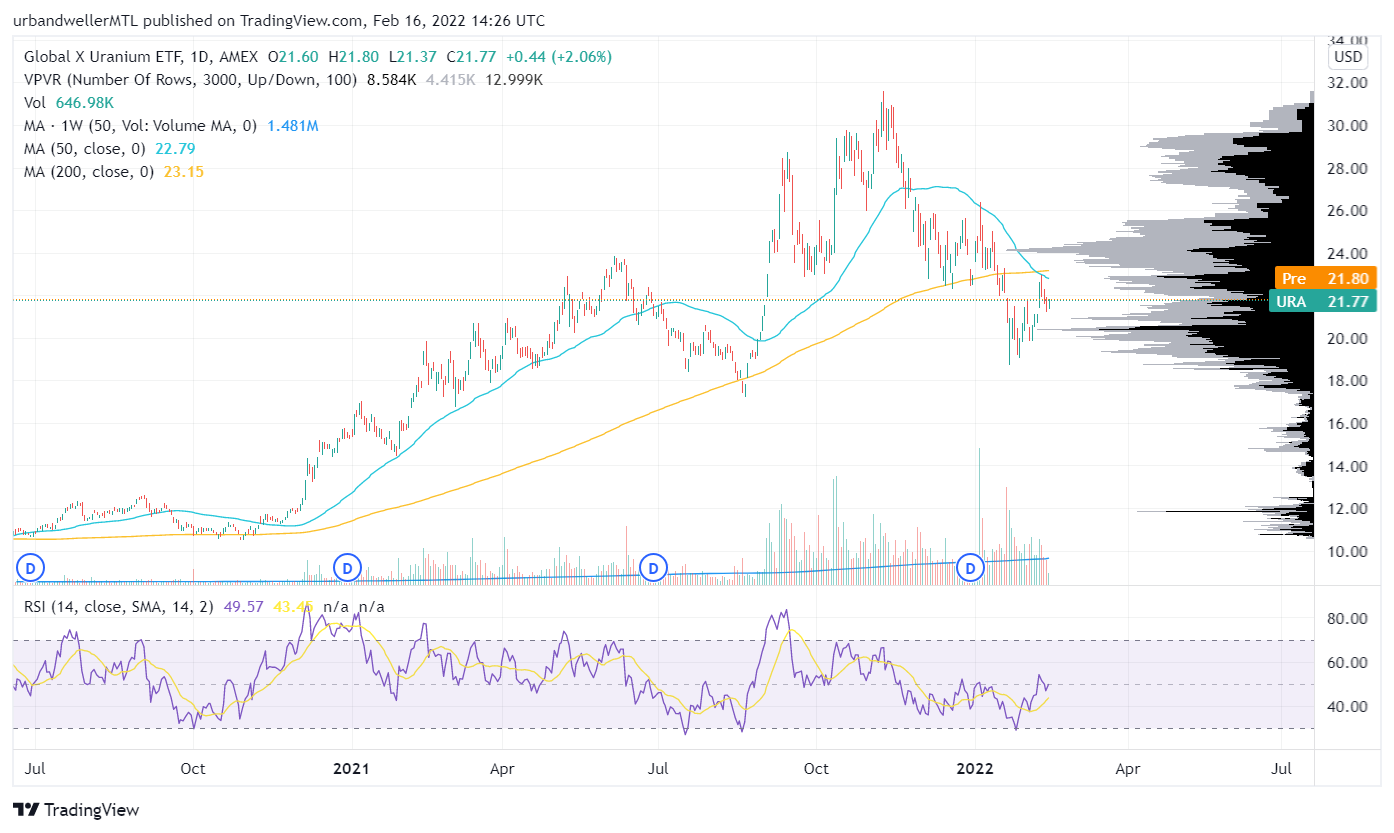
So, what has changed lately? We were positioned on BTU calls and were patiently waiting for the earnings call where we thought they would blow away analyst expectations which they did. We, therefore, closed our position on the day with +50% short-term profit. We recycled some of those profits into URA, GLD, SLV calls spreads. On the scare for the Russian invasion in Ukraine, we closed ahead of the no news day our ERUS position simply because of the uncertainty. We have opened positions in Concord gold, Trillium Gold, and Troilus gold, as well as Birchliff energy and Surge energy. Finally, looking at the cannabis sector, we seem to have hit bottom and have seen gains of 10% to 30% from the lows a couple of weeks ago.
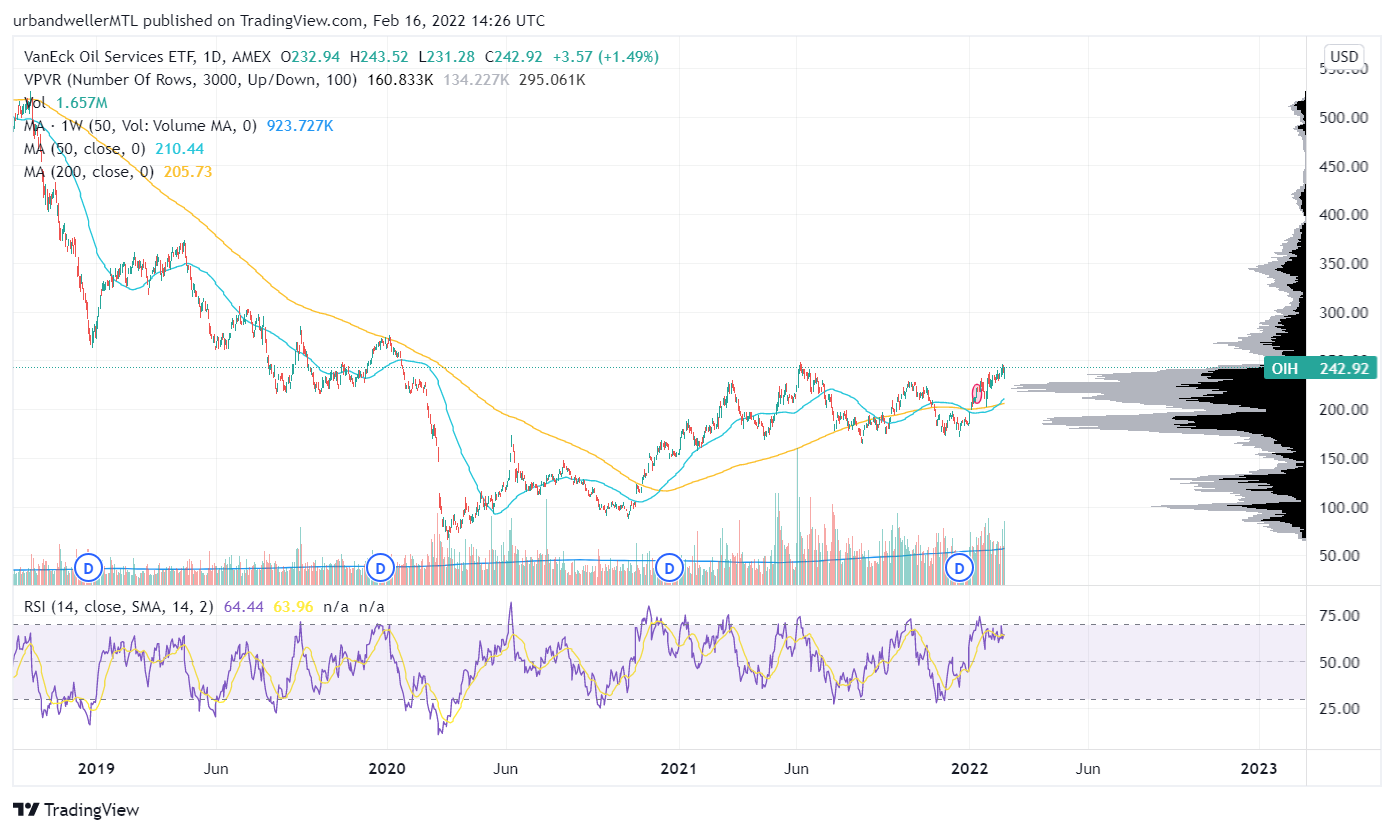
I will keep an eye out to confirm these breakout trends and add them to my initial position. The oil service sector is also seeing continued strength.
While Uranium is at a standstill for now!
Thanks for reading us!
Max
https://www.bp.com/content/dam/bp/business-sites/en/global/corporate/pdfs/energy-economics/statistical-review/bp-stats-review-2021-full-report.pdf
https://www.bp.com/content/dam/bp/business-sites/en/global/corporate/pdfs/energy-economics/bp-peak-oil-demand-and-long-run-oil-prices.pdf
https://www.researchgate.net/figure/fig1_51981619
https://www.investopedia.com/terms/f/freecashflow.asp
https://www.reuters.com/business/energy/opec-sees-upside-2022-oil-demand-forecast-strong-pandemic-recovery-2022-02-10/#:~:text=The%20growth%20forecast%20for%20overall,allowing%20further%20increases%20in%20output.
https://www.reuters.com/business/energy/oil-slides-after-france-iran-say-closer-nuclear-deal-2022-02-17/
https://www.eia.gov/petroleum/drilling/
Really enjoy these balanced and well-researched commentaries!