

The recession watchlist
The recession watchlist
Red flags everywhere

Hi Everyone,
I hope you are doing well. Today’s post is going to be a bit different than usual. We will discuss my outlook for inflation/recession in 2022 given that this should help us understand if our portfolio strategy is matching the current macroeconomics outlook. Specifically, what will we look at:
Leading economics indicators
The fed funds rate
Stock Market indicators
Leading economic indicator
A recession is two consecutive negative growth in GDP. Said otherwise, we only observe a recession once it has happened and it rarely tells us something we don’t know at that point as we have already felt the impact of the said recession in the months prior to declaring the economy in recession. Knowing this in advance, however, could prove a significant advantage in terms of maximizing your portfolio returns in the near turn. It begs the question, where are we most likely to see the first signs of a recession show up? Broadly speaking, we know from business cycles that a recession is preceded by slower and slower growth. Corporate gross margins are often reduced/squeezed which in turn reduces demand for intermediary goods/raw materials which in turn reduces demand for labor. So, where do we look to find the holy grail or the golden nugget to tell us if we are heading towards a recession?
I usually look at 5 indicators. The first ones are all related to the housing market. The housing market is a bell whether sector in the economy. There is an old saying that goes like this: if the housing sector is doing well, the economy is doing well. Therefore, I look at new housing starts and the demand for new mortgages. If there is a slowdown in these indicators, it is never a good sign. It does not mean that a recession is imminent, but you would like to see the demand for housing expanding rather than diminishing. Before we look at the indicators, one might ask, why is that so important? Housing has a multiplier effect in terms of spending. When you buy a house, as just did, we might want to redecorate, hello IKEA, buy a lawnmower, flowers, paint, a dishwasher, washer and drier so on and so forth. Basically, a lot of other manufactured goods are bought in tandem with a new house.
In the services sector, buying a new house requires most of the time a new mortgage, remember that is how money is created, which required banks to keep or hire more people in these jobs, you need a building engineer to certify that the house is structurally sound, a notary, a lawyer, a real estate agent. A lot of people are employed as a result of that industry. As for the new building permits, this signals the demand for labor in the construction sector. To recap, a lot can be learned about the health of the economy by simply looking at the construction sector.
As you can see from the below graph, the correlation between housing starts in the USA and the recession is quite strong.
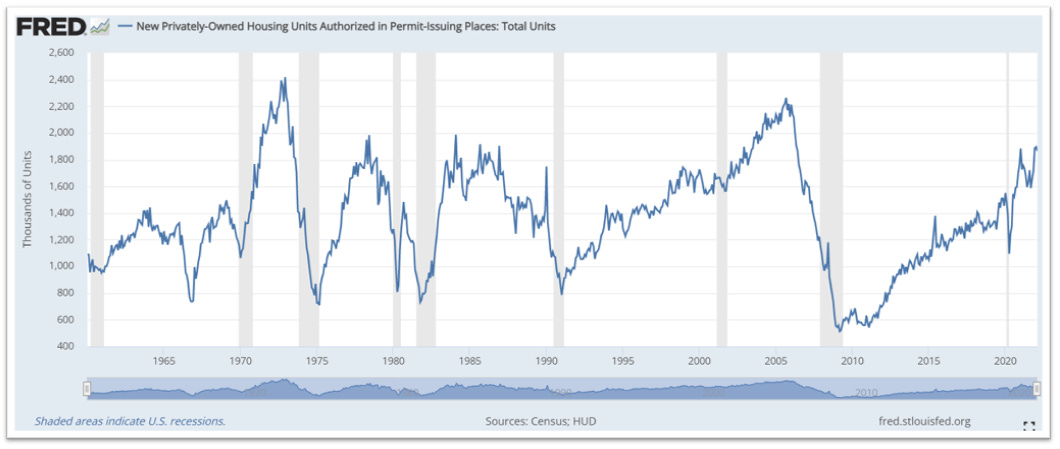
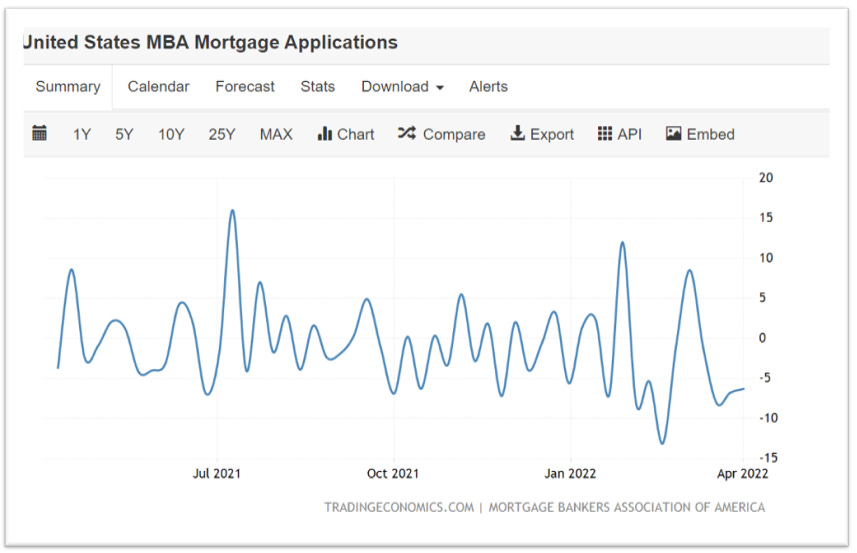
We have not seen any slowdown yet in housing starts which is great. Notice that we usually bottom in housing starts during the recession and begin our upward trajectory to recovery still within the recession timeframe. Looking at new mortgage applications, they fell for four consecutive weeks. While this is not great, we will need to keep monitoring this.
The next indicator we look at is the total vehicle sale in the USA. This is not a perfect indicator of recession but as you can see below, a significant slowdown in sales is correlated to a future recession. As pointed out by many analysts, the current slowdown in sales is in part driven by the shortage of chips which clouds the underlying real demand for cars.

The next indicator is moving one step further in the demand chain of the economy. Is the price for the transport of goods going up or down? If there is a slowdown in the economy is indeed slowing down, you would assume that the volume and price of transport are slowing down or at least decelerating. The baltic dry index: "The index provides a benchmark for the price of moving the major raw materials by sea. The Baltic Dry Index takes into account 23 different shipping routes carrying coal, iron ore, grains, and many other commodities.” This is an indication of demand for the transport of raw materials. As seen from the graph, it is indeed slowing down. But that measure is not incomplete.

We also have a note from BoA analysts highlighting the current capacity in trucking transport.
“Capacity availability jumps, pricing takes a dive
The BofA Truck Capacity Indicator, which measures the ability of shippers to find capacity, jumped to 58.7, from 44.2 last survey, its highest level since June 2020. The Rate Indicator, which measures shippers' views on truck rates, collapsed to 58.7 from 75.6 last survey, dropping well below the mid-70s to low-80s range it held in all but 2 surveys between Mar '21-Mar '22 (its lowest level since July 2020). We've noted Dry van truckload spot prices (ex-fuel) are down 37% since Dec 31 (to $1.65/mile ex-fuel from a $2.58/mile peak). The decline has accelerated, falling 27% in the past month, reflecting shifting supply/demand dynamics. Spot accounts for a small portion of truckload activity (~5%-10%) at public carriers but leads to contract pricing trends (our analysis suggests by 7-8 months (0.91 correlation). "
To recap, the demand for freight/cargo transport is not showing a pretty picture of the economy.
The next indicator we look at is total hours worked. When corporations begin to see a slowdown in orders and/or see their margins compressed, they will usually try to offset this by reducing labor overtime and non-contracted workers. This usually shows up in this indicator before we are in a full-blown recession where we begin to see layoffs. We had a sharp rebound in hours worked after covid but ever since January 2021, we have been on a downwards trajectory.

One could easily point out the fact that government has more than made up the difference between compensation from work and fiscal stimulus and we would agree with that statement as well. The caveat here is that as the government steps back from direct fiscal stimulus, as shown in the total government expenditures graph below,
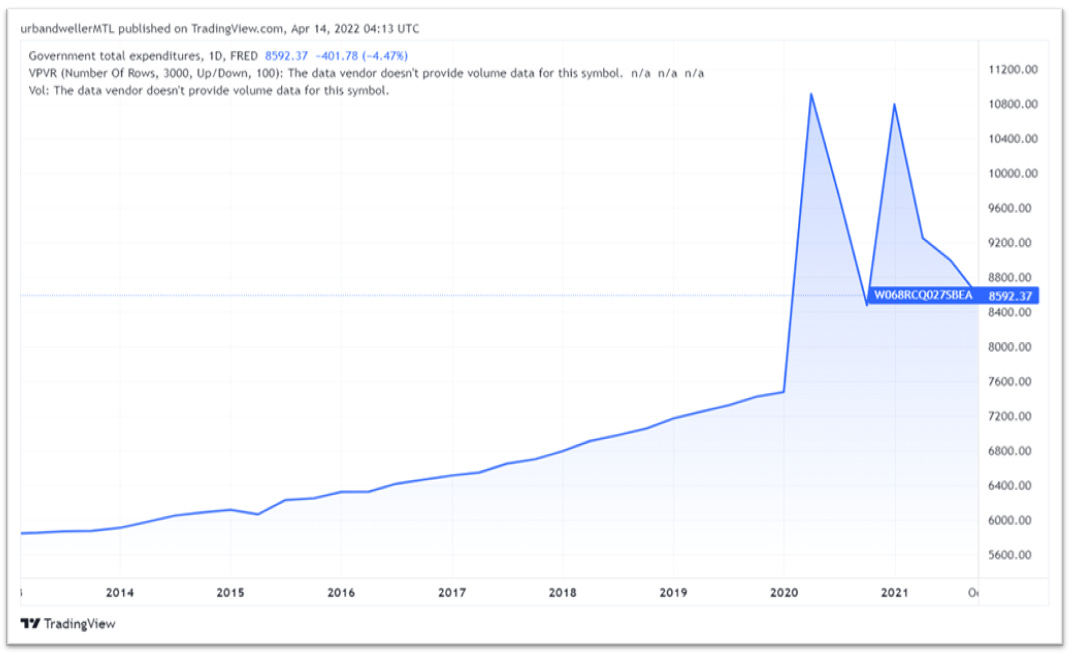
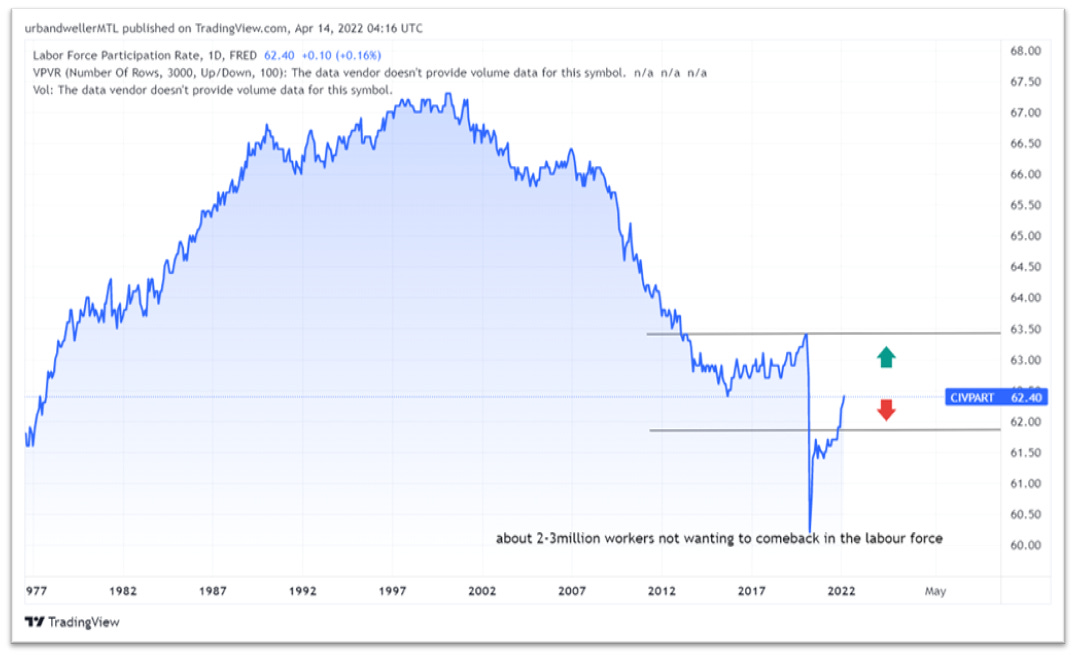
consumers will need to re-enter the workforce otherwise, their own revenues will slip and future demand in the economy will decline as well. Yet, we do not see this yet in the labor force participation rate, 15-65 age population of employed/ total 15-65 population, which still shows a gap of 2m-3m workers that still have not come back to work compared to prior covid 19 although this trend is improving.
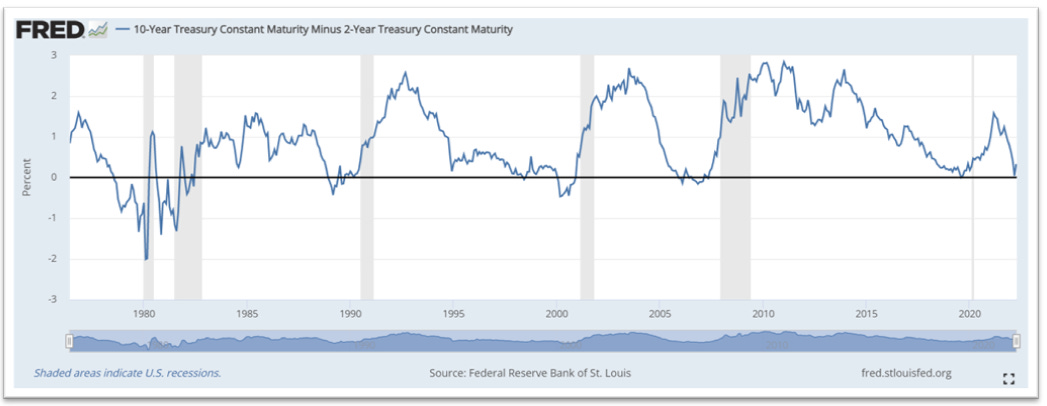
The fed funds rate
The fed funds rate is basically what sets the interest rates on most loans/mortgages in the world. Since the USD is the world reserve currency and most countries outside the USA like to use the USD as a neutral currency to exchange in it, therefore, becomes the most important of the central banks around the world to watch. Now the reason we like to look at the 10year minus the 2 years is that in a strong economy, you would expect the interest rate on longer dated maturity, in this case, the 10 years, to be higher than the shorter-dated maturity simply because you take on more duration risk, i.e more time risks, than if you were to borrow for a shorter period of time. Simply put, the longer the reference time is, the less certainty we have about it. As you can see from the below when you subtract the 2-year yield, you can use the rate for simplicity, from the 10-year yield and this turns negative, i.e the shorter-dated maturity has a higher interest rate than the longer-dated maturity, we have a significant correlation to a recession. As the blue line touches/passes through the black line, as we currently see, we always had a recession in the next 6-12 months in the past 6 recessions. Not looking great.
The stock market
It is often said that the stock market is a leading indicator of the economy. In an economic slowdown/recession, we expect to see investors move towards a more defensive part of the stock market. First, we look at the total market performance. We use the Willshire 5000 as a proxy for the total US market.
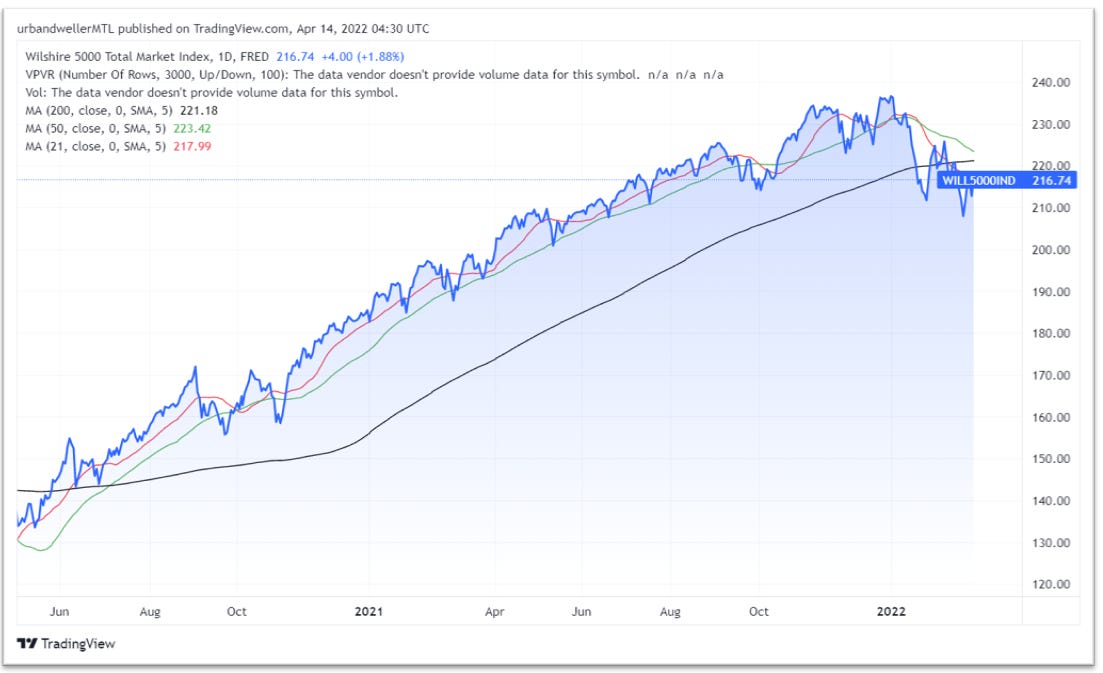
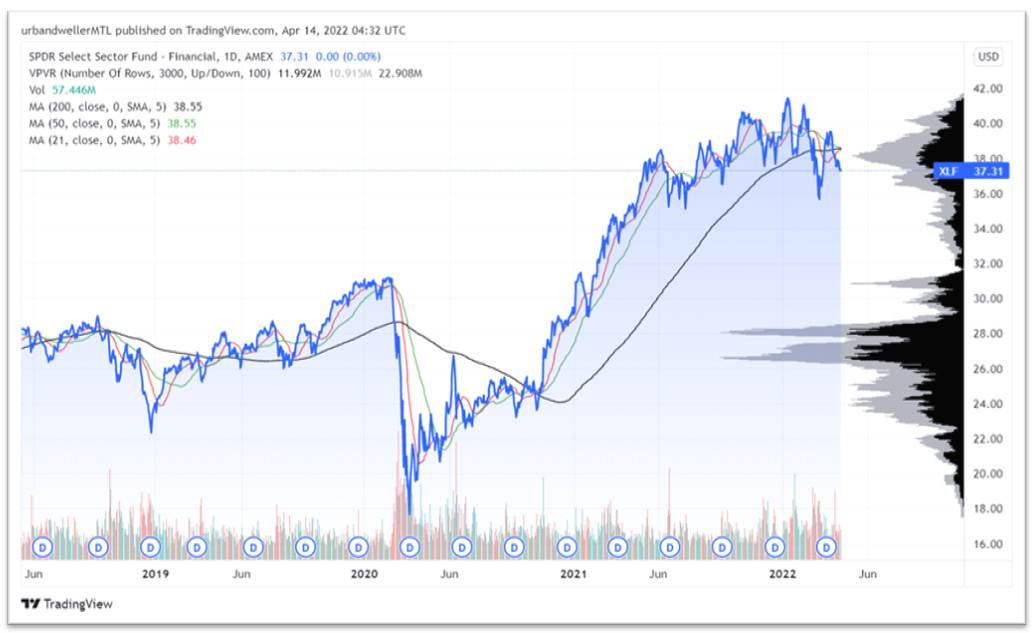
We have seen the market below its 200-day moving average which is usually a very bearish indicator. Next, we look at the financials since they are severely hit by lower origination fees on mortgages and lower loan demand when recessions are underway. This also has rolled over and now stands below its lower 200-day moving average price.
Finally, we look at utilities which is a usual place to deploy capital when sentiment for the total stock market shifts.

As you can see from the above, it usually peaks before a recession, and we are peaking.
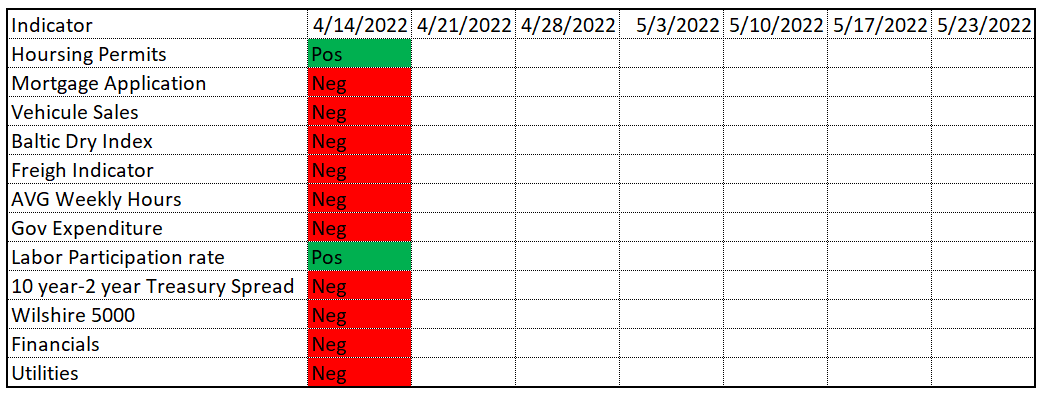
I will keep updating the below table in the coming weeks and share my thoughts on where we are.
Have a great week and thanks for reading!
Max
appreciated
hello Max. I just need to say how grateful I am for the educational content you produce, my mind keeps expanding! thanks