

An Earnings recession?

Hi Everyone,
Eight weeks ago (it seems already quite dated) I published the first recession watchlist article. This week’s article is a follow-up on where we are and what I think it means for the months ahead.
The structure of today’s article is as follows:
1-Review the indicators
2-Interpret where we are in the cycle and infer what is the likely path forward
3- Strategies moving forward
The indicators
Liquidity
Our first indicator is from the Chicago Fed. It is a good proxy for liquidity in the financial system. Positive values are generally correlated with tighter than usual financial conditions. As of July 2021, this index is slowly but surely tightening driven by less government stimulus and more recently an increase in interest rates. This is generally negative for the stock market as we have come to understand that liquidity in the system is highly correlated with a stronger stock market and a de facto stronger economy.

Inflation
The question at this point is, will inflation stabilize, decrease or increase? One great way to figure out if long-term inflation expectations are is to look at the five-year forward five-year inflation. Basically, it means looking at the 2027-2032 time period. The Federal reserve of ST-Louis compiles this data for us. As we can see from the graph, market participants have increased their forecast of inflation ever since march 2020 when we hit a decade low.

What about short-term inflation expectations? The below is taken from the BLS ( bureau of labor statistics in the USA). Looking at the big categories; Food, Energy, commodities, services, shelter, medical care, and transportation. Let us unpack those categories.

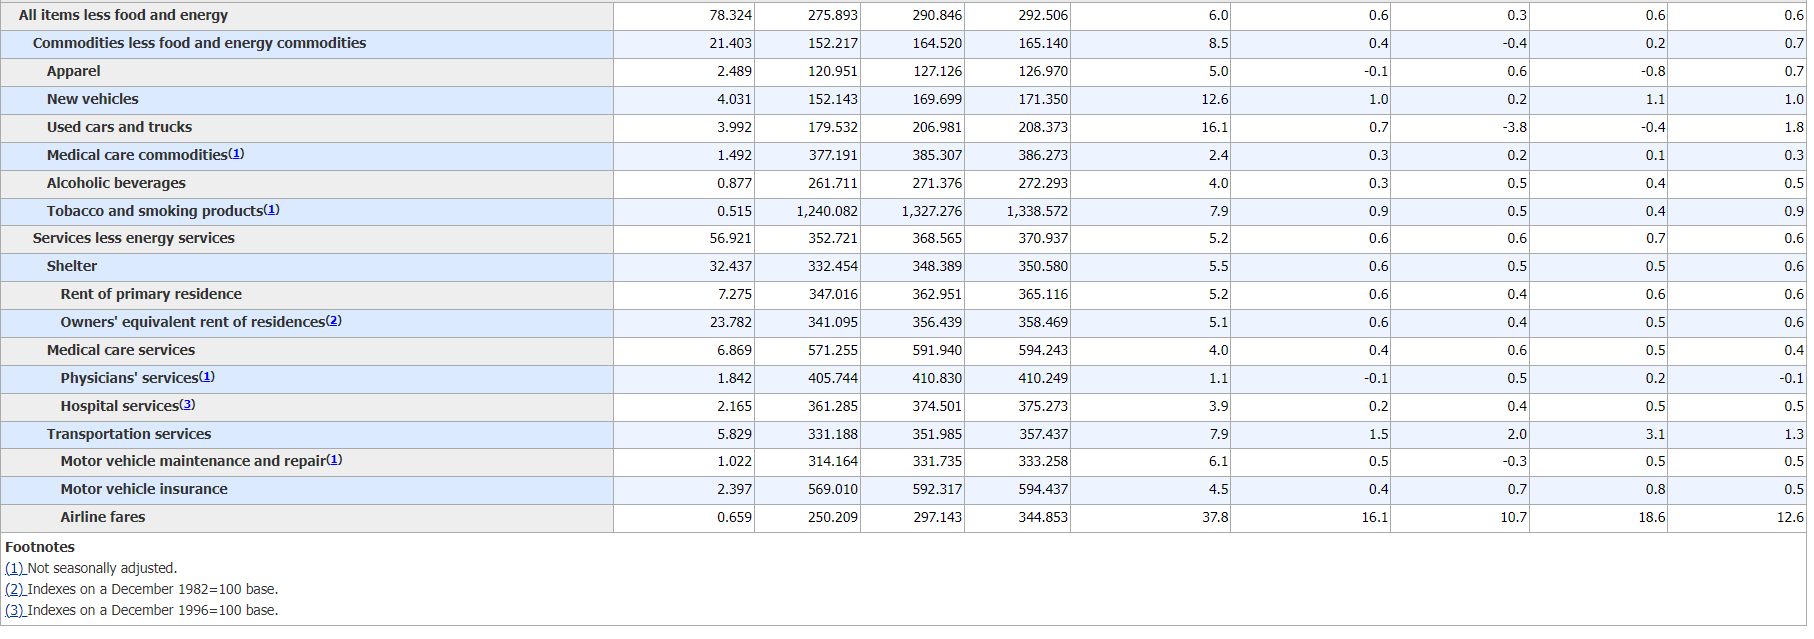
On the food front, knowing that energy, transport, packaging, and wages are the biggest cost component and that those items are higher than they were last year, for the rest of the year, they will maintain an inflationary pressure on the CPI readings. On the energy front, last year’s gasoline prices hovered between 2$-2.5$ a gallon in the USA. As the below gasoline graph shows, we have been significantly higher this year compared to last year which means that we will keep seeing the inflationary pressure on the CPI until year-end.

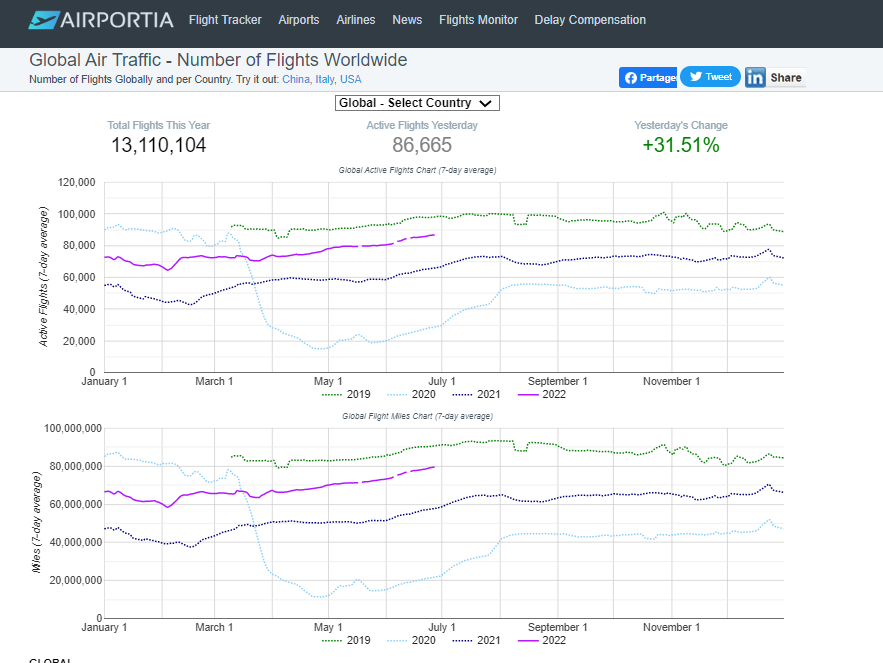
On the transports, the same comment could be made that unless and until the energy costs come down, it will be nearly impossible to see these components become disinflationary. As the below airplane tracker shows us, we have been locked because of covid for the past 2 years and the common mood is to enjoy traveling now. We are getting back closer to 2019 levels.
On the shelter front, for rents, we again see inflationary pressure at least until year-end.

Recapping what we just went through, long-term inflation expectations, as well as short-term inflation indicators, are likely to show elevated inflation at least until year-end.
Growth
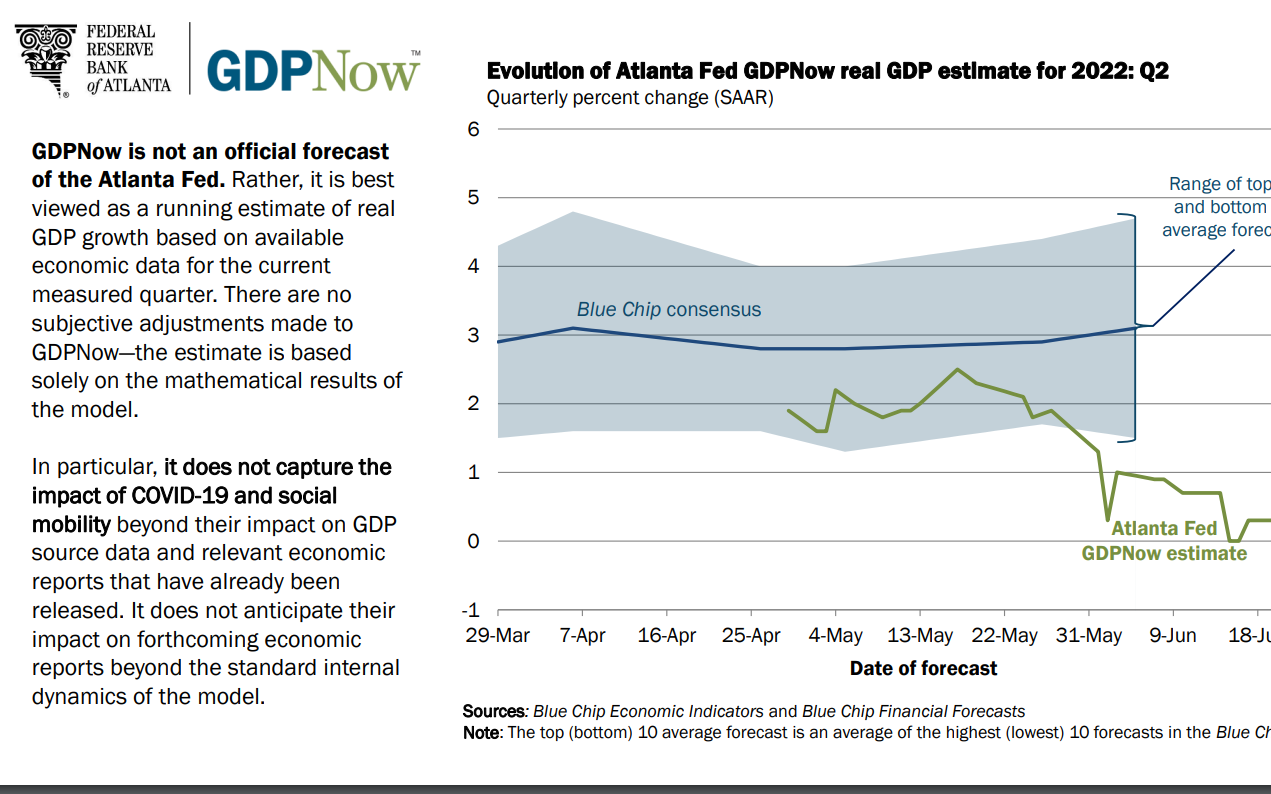
The Atlanta Fed publishes an early indicator of future forecasted GDP. Interestingly enough, after the first quarter of negative real growth in 2022, they now basically see no growth in Q2 for the USA economy. If this number were to turn negative, we would have the technical definition of a recession. Whether it turns out to be negative or not, we still are miles away from a roaring GDP which will have a ripple effect as we will explore later in this post.
The Framework
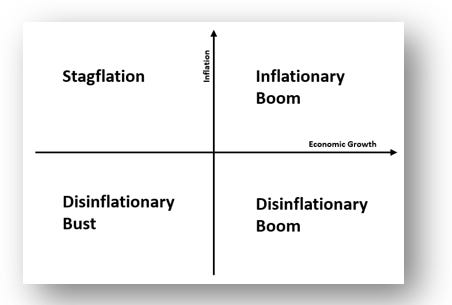
Knowing what we know now, we can describe the future outlook of growth as being slowing down if not outright negative driven by less fiscal impulse highlighted by the financial condition index and the Atlanta fed survey. We also know that we have a short-term expectation of elevated inflation and longer-term inflation has increased from its lows in 2020. Given those data points, we can identify the current situation in the investing landscape, highlighted by the 2x2 matrix below, as moving into the stagflation quadrant where inflation is likely to remain high and economic growth will go nowhere.
Implications for the Market
Corporate Earnings and valuation
Looking at the stock market and the profitability of companies, the consensus for 2022 and 2023 earnings is to see continuous growth year over year.

S&P500 Earnings per share aggregate
The below 2 charts are provided by S&P 500 and explained 2 key components of the stock market valuation. The earnings per share and the price/earnings multiple.
Price/ Earnings ratio

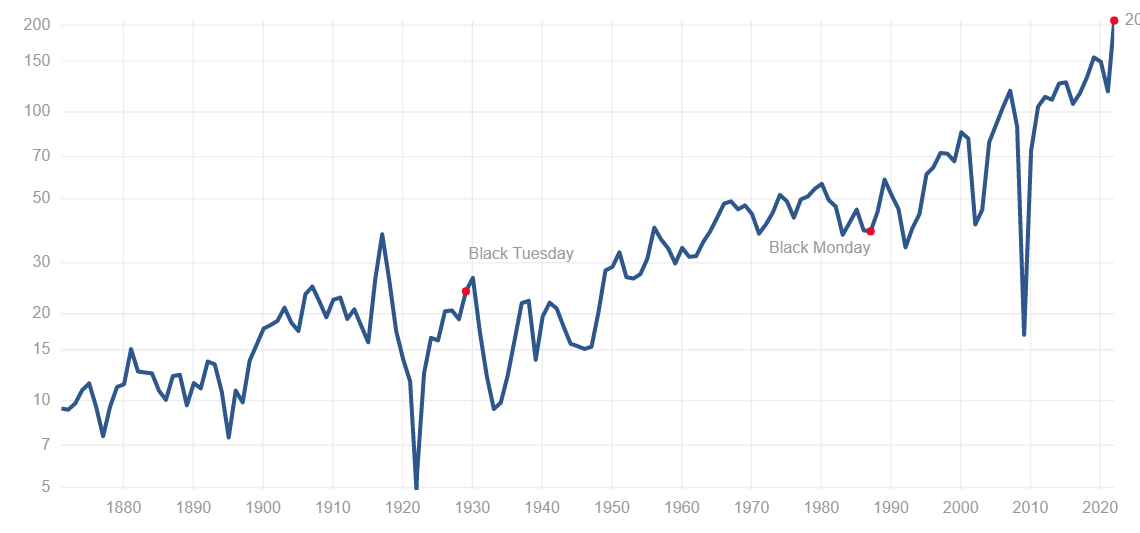
The market is usually a discounting mechanism of the real economy forward-looking by 3 months approximately. Year to date, we have seen the market, major market indices, go down from a valuation standpoint whilst the consensus of earnings remained in growth. What we know from prior slowdowns and recession however is that we do see earnings per share go down.
Assuming a normalized P/E of 15 and an EPS of $200, roughly 10%-20% earnings recession, that would lead us to an S&P500 of 3000 from its current levels of 3800-4000. What is likely to perform well in this situation? Cash, shorting the market, commodities, gold, REITS. I feel less comfortable with commodities, gold, and Reits as I see the slowdown affecting the demand for commodities in general (grains and energy might still do well). Cash sounds like the safest bet while shorting the market at this point is somewhat expensive given that we have seen already a correction of 20% from the highs. There might still be a decent risk/reward on out-of-the-money puts for the next 6-12months.
what do you think will do well? I am tempted to raise a bit of cash and sell a bit of uranium to open a short position on the S&P500 or the Russel 2000 for the next 6 months.
Stay safe out there and thanks for reading!
Max